One of the main features of the G-Station solution is its focus on automation. The software allows accelerating drive test data analysis for mobile network optimization. In the video below we show how we can create a simple SSV (Single Site Verification) drive test report in a few minutes, by leveraging on the Custom Design Center tool in G-Station. Network operators and vendors can exploit this functionality to accelerate their rollout and RF optimization projects.
Thats it! With a few clicks, and in less than 10 minutes* we obtained a standarized deliverable that fits the customer’s needs.
Teh report with built in the video is 100% customizable. In the Custom Design Center (CDC) we can create a template that adapts to the customer’s requirements.
In our example we present a fairly simple report, however this deliverable can grow in complexity. For instance, the user can leverage on the G-Station built-in toolboxes to automatically add information about overshooting analysis, missing neighbors, low throughput diagnosis, dropped call reason analysis, among others.
*Clarification: Logfiles load in any postprocessing tool may take more than 10 minutes, since it depends on the input data size. In this post’s title, we are referencing the time it takes to actually create the deliverable, not including the time taken to load the data in the tool.
Custom Design Center (CDC): The key to automating drive test report generation
The Custom Design Center is one of the most useful modules in G-Station. It allows to create customized report templates in PowerPoint, PDF, HTML (Web) or Excel.
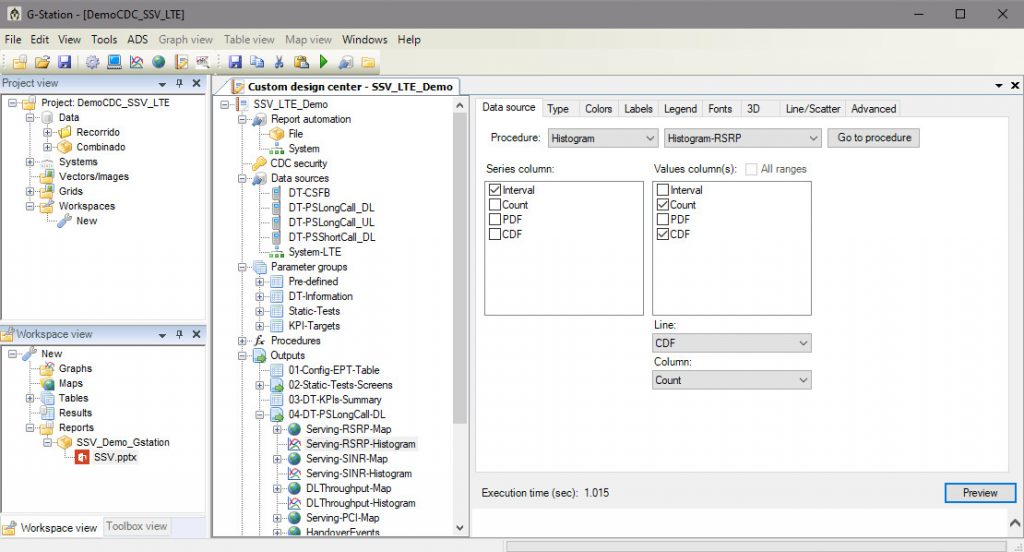
CDC Components
To create a report template as the one shown in the video, we should configure the following items:
Data Sources. Test terminals that are a part of the drive test protocol.
Parameters. Optional variables that can be used to apply filters, calculation steps or simply present in the report.
Procedures. These are a set of instructions to process the data. FOr instance: Calculate the drive test KPI, obtain data for a histogram, apply a filter to a table.
Outputs.Data visualizations that can be included in the report: Maps, Tables or Charts.
Layouts. The actual design of the report, based on the previously created outputs. It can be in PPT/PDF, Excel or HTML format.
Please note that this configuration is done only once at the beginning of the project. Afterwards, the operator just “runs” the report, as shown in the video.
Main benefits for operators
Having an automated tool as G-Station brings multiple benefits to mobile network operators or vendors:
- Accelerate network rollout by reducing drive test postprocessing time to a minimum.
- Ensures a unique and standardized criteria for the deliverables of a RF optimization project.
Brings higher flexibility to operators by allowing the usage of multiple types of data collection software. G-Station generates the same deliverable regardless of the software used to preform the drive test.
- If the operator has a G-Net license, the report generation process is performed on the cloud. The operator simply uploads the logfile and then receives the deliverable via e-mail in a few minutes.
Conclusions
G-Station allows mobile network operators to accelerate drive test data analysis in RF rollout and optimization projects. With the CDC, operators can ensure consistency and quality in the deliverables. Also, RF engineers will spend less time “copying and pasting” images, and invest it in what really matters: drive test performance evaluation, finding and solving network issues.
In this article we presented a quick demonstration of the benefits of G-Station. Ekspresa has partnered with Gladiator to bring this solution to our customers in Latin America. Would you like to know more about this solution or are you interested in a Demo? Please contact us!