During the next few weeks we will be presenting on our blog the results of the LTE coverage measurements that Ekspresa has carried out in three markets: Panama City, Mexico City and Santo Domingo (Dominican Republic). Using the CellWireless solution, we did several drive tests in emblematic areas to evaluate and compare the levels of signal intensity and interference in the LTE networks of the mobile network operators that provide service in these cities.
In this article we present the results of the LTE drive tests carried out in the financial area of Panama City, collected in October 2020, comparing the LTE coverage of the operators Cable & Wireless, Claro, Digicel and Tigo.
We want to highlight that the analysis that we will present in this article is based exclusively on the signal levels (RSRP and CINR) measured on LTE cells. This information, while very valuable, does not provide a complete picture of the quality of the user experience on a mobile network.
To carry out a complete benchmarking of the quality of service of mobile operators, additional measurements are required using mobile terminals, carrying out an extensive test protocol for voice and data services. Even though Ekspresa has wide experience in this type of project, for this publication we limit ourselves only to measurements collected with the scanner.
LTE coverage evaluation methodology
We briefly describe the methodology used for this study.
General considerations
- Measurement date and time: Monday, October 5/2020, from 2:30 PM to 4:30 PM and Saturday, October 15/2020 from 3:30 PM to 4:30 PM.
- Drive tests performed by the Ekspresa Panama engineering team.
- Measurement equipment: The Celplan CellWireless solution was used: CellDigitizer Scanner + Cellscanner Software. 2.7 GHz bandwidth antenna with 4 dBi average gain. Equipment calibrated in October 2019.
- Drive test route: main roads and streets – Financial area of Panama City.
- Post-processing applying binning by distance. Measurements within hexagons of an area of 307m² are averaged, using Uber’s h3 hexagonal system.

Frequencies
The equipment was configured to collect measurements at the following frequencies:
| Operador | Banda | # Canal (EARFCN) |
|---|---|---|
| Cable & Wireless | 700 MHz | 9285 |
| Cable & Wireless | 1900 MHz | 1150 |
| Claro | 700 MHz | 9510 |
| Claro | 1900 MHz | 875 |
| Digicel | 700 MHz | 9610 |
| Digicel | 1900 MHz | 675 |
| Tigo | 700 MHz | 9410 |
| Tigo | 1900 MHz | 1050 |
| Tigo | 2100 MHz (AWS) | 2175 |
LTE coverage sample categorization criteria
In cellular networks, there are indicators that are used to show the level of signal intensity (received power) and signal quality (signal-to-noise ratio) with which the mobile decodes the cell transmissions.
In LTE, we usually use the RSRP (Reference Signal Received Power) to measure the signal strength, and the RSRQ (Reference Signal Received Quality) and CINR (Carrier to Interference and Noise Ratio) to measure the signal-to-noise ratio. Describing the meaning of these metrics is beyond the scope of this article, however, we refer the reader to this link if they want to further explore these definitions.
In the next analysis we will use the RSRP and the CINR for the evaluation of LTE coverage. In addition to presenting the individual RSRP and CINR values, we define three coverage “tiers” that take both metrics into consideration.
- Level 3. Good Coverage. RSRP > -100 dBm, CINR > 10 dB
- Level 2. Regular Coverage. RSRP > -100 dBm, CINR
- Level 1. Bad Coverage. RSRP
In the field of Radio Frequency analysis the term “coverage” is often used to denote only the level of signal intensity (RSRP), however in this article we will use this word to refer to the combined indicator.
To calculate the coverage level in each area point, the RSRP and CINR samples collected with the scanner are averaged over the hexagonal area (300 m²). After this, in each hexagon the RSRP and CINR of all the frequencies in Table 1 are evaluated, and the best level of coverage is selected from among all the channels found for each operator. For example, if in a certain area the X operator has -110dBm of RSRP / -10 dB of CINR for EARFCN # 1 (which corresponds to level 1), and has -85dBm RSRP / 25dB CINR (Level 3) for EARFCN # 2, then this area will be considered level 3.
Results: Who has better LTE coverage in the banking area of Panama City?
Fig 1. shows a map with the comparison of the three operators for the indicator “Level of Coverage” described in the methodology. The map is interactive: you can select the metric to evaluate, change the frequency and / or zoom.
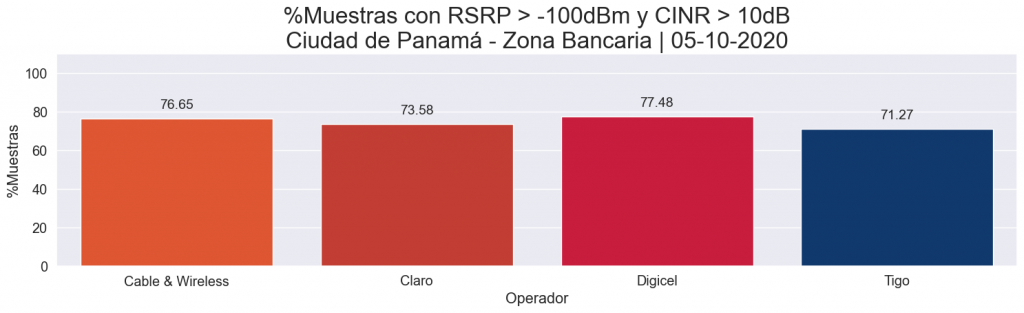
The four operators have comparable levels of coverage and quality. As can be seen in Fig. 2, Digicel and Cable & Wireless operators are slightly above Claro and Tigo.
Let’s examine the RSRP and CINR individually:
RSRP comparison
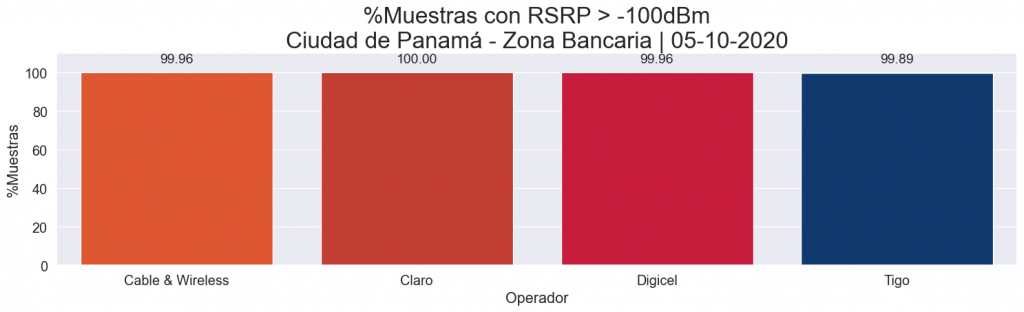
The following figure shows the RSRP statistics for the four operators, where it can be seen that they all have more than 99% of the samples above -100 dBm.
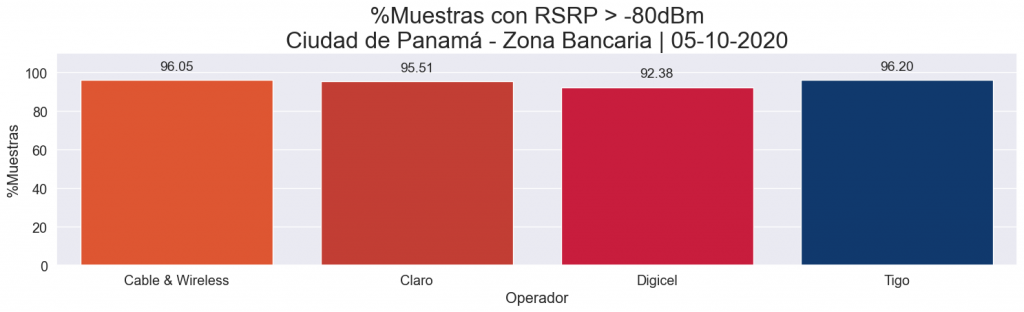
If we raise the threshold to -80dBm, we see that Cable & Wireless, Claro and Tigo remain above 96%, while Digicel remains at 92%.
In the following image we see the distribution of samples per LTE carrier. As expected, carriers in the 700MHz band have better RSRP levels.
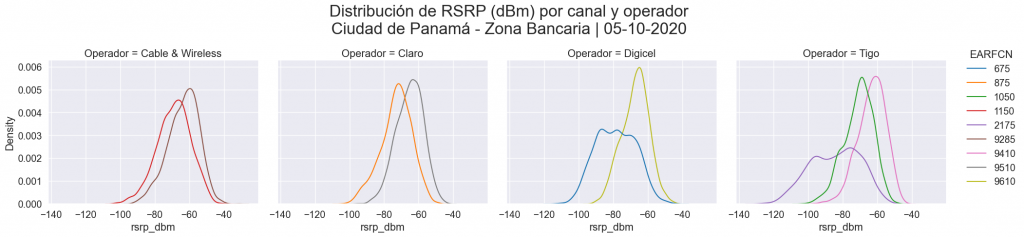
In conclusion, at the signal intensity level, the four operators have comparable signal intensity levels.
CINR comparison
Evaluating the CINR, it can be seen that the operators Digicel and Cable & Wireless have a slight advantage.
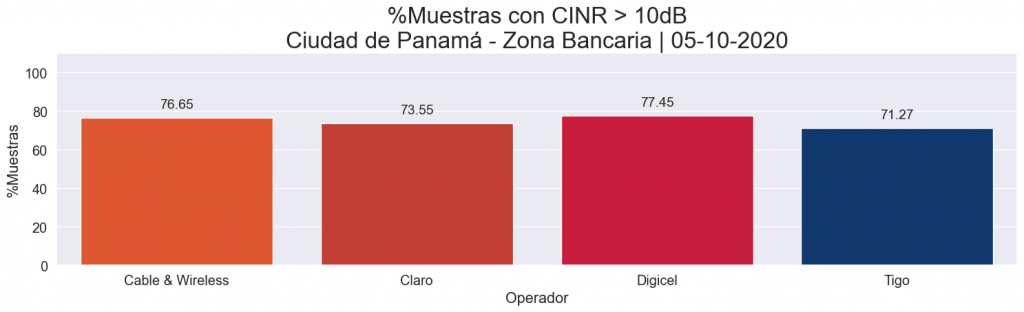
This chart is similar to that of Fig. 2. This makes sense: since all operators have acceptable RSRP levels within the route under study, the “Coverage Level” indicator is modeled by the CINR .
Examining the data by carrier, we have the following density chart:
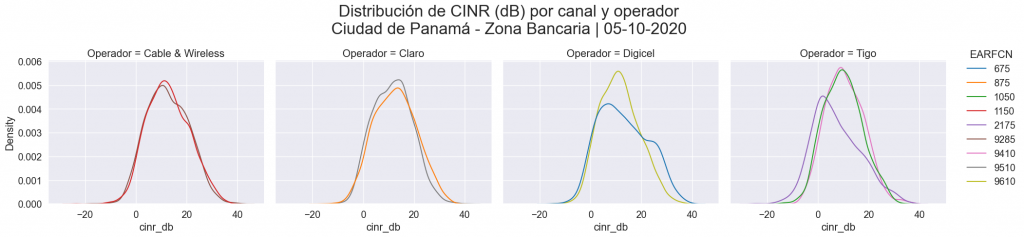
In general, the CINR distribution for all carriers is similar. Calls our attention that for the Tigo operator, the 2100 MHz carrier (AWS) has a higher sample density around 0dB, compared to the remaining carriers that are centered at 10dB.
There are multiple reasons that can affect the level of interference in an LTE network. Among the most common are:
- Reference signal pollution (pilot pollution).
- High traffic load in cells.
- MOD 3 interference
- External Interference.
Conclusions
From this brief study we can conclude the following:
- The four operators generally have similar levels of coverage and quality in the area studied.
- Digicel has a slight advantage over its competitors when it comes to signal-to-noise ratio comparison.
- All operators efficiently take advantage of the 700MHz band to offer good levels of signal strength. More than 95% of samples are above -80dBm on average. This favors indoor coverage scenarios.
- We emphasize that the analysis of signal intensity and interference only provides a partial picture of the performance of a mobile network and the user experience. To carry out an exhaustive comparison between operators, a benchmarking must be made where the different voice and data services are measured.
- The CellWireless spectrum analyzer and scanner solution is a powerful and effective tool for performing this type of coverage analysis on mobile networks.
We have prepared a PDF reports with the detailed maps per operator and channel. To access this information and the raw data (in plain text) please email us to info@ekspresa.com or through our contact form.
During the coming weeks, the Ekspresa team will continue to carry out coverage measurements on emblematic roads of Panama City. We invite you to follow us on Linkedin to be notified when the next studies are available.