Continuing with our LTE coverage measurement posts, this week is for Mexico City. In this article we present a comparison of the measurements for the operators Altan, AT&T, Telcel and Telefonica in some emblematic highway corridors of Mexico City.

Measurements were collected using Celplan’s CellWireless multi-technology scanner solution.
We want to highlight that the analysis that we will present in this article is based exclusively on signal levels (RSRP and CINR) measured on LTE cells. This information, although very valuable, does not provide a complete picture of the quality of the user experience on a mobile network.
To perform a complete benchmarking of the quality of service of mobile operators, additional measurements are required using mobile terminals (typically smartphones) performing an extensive test protocol for voice and data services. Even though Ekspresa has extensive experience in this type of project, for this publication we limit ourselves only to measurements collected with the scanner.
In the next section we present the methodology followed in the study. This includes test conditions, dates of the collections, and equipment characteristics. Later, we will show an interactive map with the results by operator and channel, as well as a brief analysis of the results.
LTE coverage evaluation methodology
We briefly describe the methodology used for this study.
General considerations
- Measurement date and time: Saturday, Oct 3rd/2020, from 12:30 PM to 7:00 PM and Saturday Oct 17/2020 from 9:30 AM to 3:30 PM.
- Drive tests performed by the engineering team of Ekspresa Mexico.
- Measurement equipment: The CellWireless solution from Celplan was used: CellDigitizer Scanner + Cellscanner Software. Antenna with 3.5 GHz bandwidth. Equipment calibrated in October 2019.
- Drive test route: main road corridors in Mexico City.
- Post-processing applying binning by distance. Measurements are averaged within hexagons of an area of 2149m², using Uber’s h3 hexagonal system.

Frequencies
The equipment was configured to collect measurements at the following frequencies:
| Operador | Banda | # Canal (EARFCN) |
|---|---|---|
| AT&T | 2.6 GHz | 3150 |
| AT&T | 2.6 GHz | 37900 |
| AT&T | 2.6 GHz | 38098 |
| AT&T | 850 MHz | 2466 |
| AT&T | 2100 MHz (AWS) | 2250 |
| AT&T | 850 MHz | 2475 |
| Altan | 700 MHz | 9310 |
| Altan | 700 MHz | 9435 |
| Altan | 700 MHz | 9560 |
| Telefonica | 1900 MHz | 900 |
| Telefonica | 2.6 GHz | 3350 |
| Telcel | 2100 MHz (AWS) | 2050 |
| Telcel | 850 MHz | 2585 |
| Telcel | 2.6 GHz | 2825 |
| Telcel | 2.6 GHz | 2975 |
| Telcel | 2100 MHz (AWS) | 67036 |
LTE coverage levels definition
In cellular networks, there are indicators that are used to indicate the level of signal intensity (received power) and signal quality (signal-to-noise ratio) with which the mobile decodes the cell transmissions.
In LTE, we usually use RSRP (Reference Signal Received Power) to measure signal strength, and RSRQ (Reference Signal Received Quality) and CINR (Carrier to Interference and Noise Ratio) to measure signal to noise ratio. Describing the meaning of these metrics is beyond the scope of this article, however we refer the reader to this link if they want to further explore these definitions.
In the next analysis we will use the RSRP and the CINR for the evaluation of LTE coverage. In addition to presenting individual RSRP and CINR values, we define three coverage “levels” that take both metrics into consideration.
- Level 3. Good Coverage. RSRP > -100 dBm, CINR > 10 dB
- Level 2. Regular Coverage. RSRP > -100 dBm, CINR
- Level 1. Bad Coverage. RSRP
In the Radio Frequency field analysis, the term “coverage” is usually used to indicate only the level of signal intensity (RSRP), however in this article we will use this word to refer to the combined indicator.
To calculate the level of coverage in each area point, the RSRP and CINR samples collected with the scanner in the hexagonal area (2149m²) are averaged. After this, in each hexagon the RSRP and CINR of all the frequencies in Table 1 are evaluated, and the best level of coverage is selected from among all the channels found for each operator. For example, if in a given area the X operator has -110dBm RSRP / -10 dB CINR for EARFCN # 1 (which corresponds to level 1), and has -85dBm RSRP / 25dB CINR (Level 3) for EARFCN # 2, then this area will be considered level 3.
Results: Who has better LTE coverage?
In Fig. 1. a map is shown with the comparison of the three operators for the indicator “Level of Coverage” described in the methodology. The map is interactive: you can select the metric to evaluate, change the frequency and/or zoom.
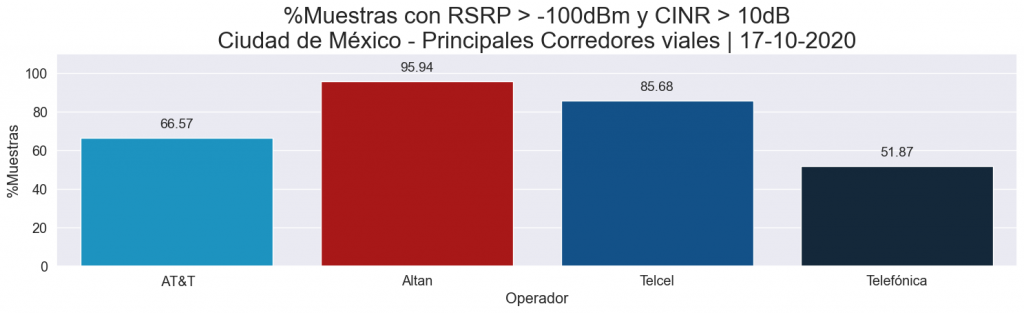
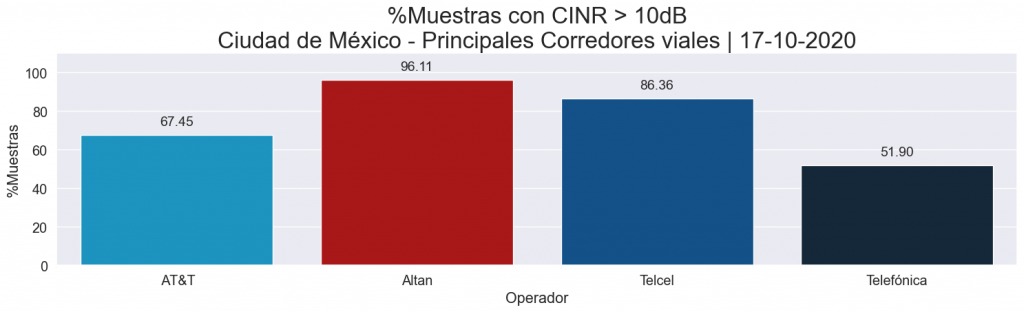
We can see that Altan and Telcel operators have a greater amount of level 3 samples. The numerical result can be seen in Fig. 2.
Let’s examine the RSRP and CINR individually:
RSRP comparison
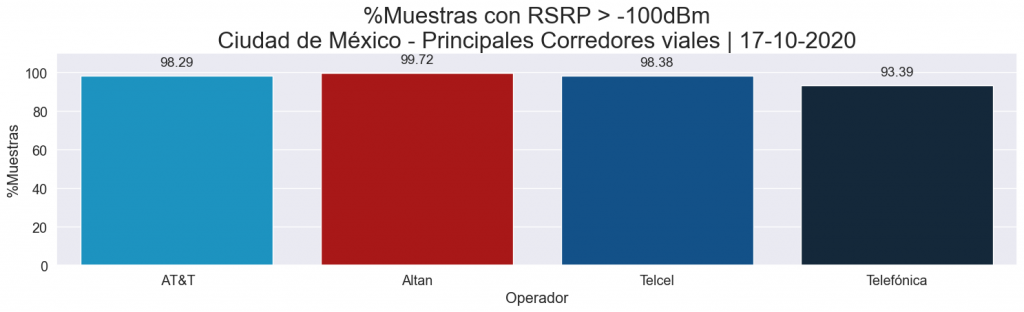
The following figure shows the RSRP statistics for the four operators, where AT&T, Altan and Telcel have more than 98% of the samples above -100 dBm, while Telefonica lags slightly behind with 93%.
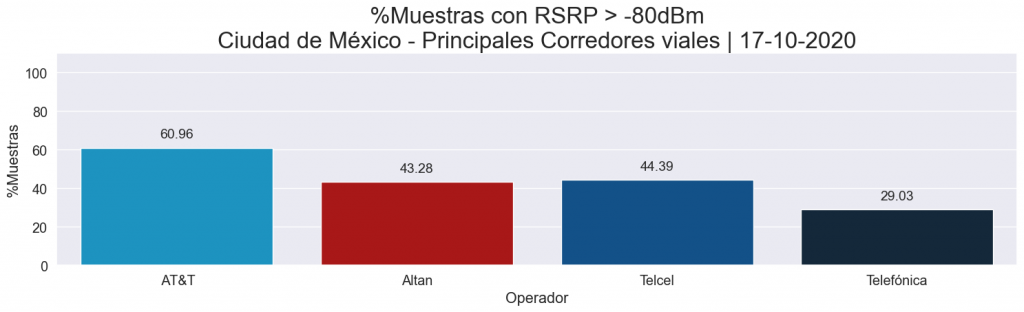
If we raise the threshold to -80dBm, we appreciate that AT&T takes advantage of the other operators.
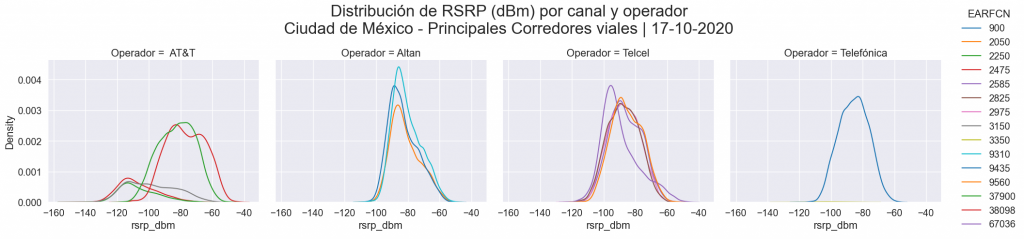
In the following image we can see the distribution of samples by carrier. It is appreciated that AT&T has two carriers with high sample density above -80dBm: 2250 (850 MHz) and 2475 (AWS).
Having better RSRP levels favors indoor coverage conditions. In this area, AT&T has better levels within the route studied.
CINR comparison
Comparing the CINR, we appreciate that Altan operator has more samples above 10dB than its competitors.
This graph is similar to the one in Fig. 2. This makes sense: since all operators have acceptable RSRP levels (> -100dBm) within the route under study, the “Coverage Level” indicator looks like modeled by CINR.
When we examine the data by carrier, we obtain the following density graph:
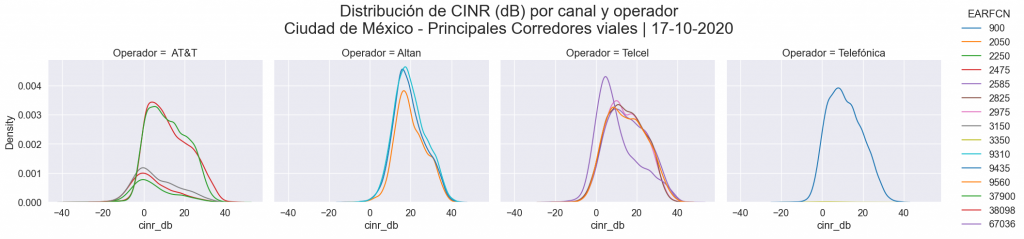
We can see that all Altan carriers have, on average, a significant sample density between 15 dB and 20 dB.
There are multiple reasons that can affect the level of interference in an LTE network. Among these we have:
- Traffic load in cells. This indicator is modeled by the number of subscribers the network has and the available capacity.
- Reference signal pollution (pilot pollution). The correct planning and optimization of the network helps to minimize this phenomenon.
- MOD 3 interference
- Interferencias externas.
The following chart shows the load percentage* measured by CellScanner for the 4 operators. Measurements from all bands are accumulated in a single histogram. We can see that Altan and Telcel have a higher proportion of samples below 50% load. This is consistent with the results in Fig. 6, where we see that these two operators have the best CINR levels.
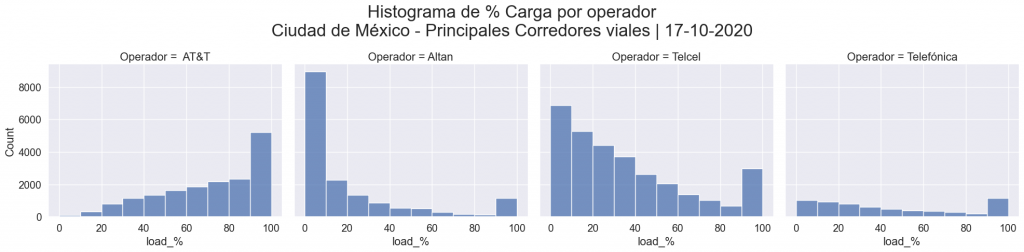
* CellScanner generates this indicator by measuring the average load in the subframes that carry the cell reference signal.
Conclusions
From our study we can conclude the following
- All four operators have good signal strength levels (RSRP). AT&T stands out in this area by having a higher percentage of samples above -80dBm, which favors indoor coverage.
- Altan and Telcel have better levels of CINR.
- The main limitation on signal quality for all operators is given by the CINR. This behavior is to be expected given the characteristics of the area (urban environment with a high density of base stations).
- We emphasize that the analysis of signal intensity and interference only provides a partial picture of the performance of a mobile network and the user experience. To carry out an exhaustive comparison between operators, a benchmarking must be made where the different voice and data services are measured.
- The CellWireless spectrum analyzer and scanner solution is a powerful and effective tool for performing this type of coverage analysis on mobile networks.
We have prepared a PDF report with detailed maps by operator and channel. To access this information and the raw data (in plain text format) write to us at info@ekspresa.com or through our contact form to request access.
During the next weeks the Ekspresa team will continue to publish results of other measurements in the city. We invite you to follow us on Linkedin to be notified when the next studies are available.