
The measurements were collected using the multi-technology solution CellWireless, by Celplan.
We want to highlight that the analysis that we will present in this article is based exclusively on the signal levels (RSRP and CINR) measured on LTE cells. This information, while very valuable, does not provide a complete picture of the quality of the user experience on a mobile network.
To perform a complete benchmarking of the quality of service of a mobile network, additional measurements are required using test terminals (typically smartphones) performing an extensive test protocol for voice and data services. Even though Ekspresa has extensive experience in this type of project, for this series of publications we limited ourselves only to measurements collected with the scanner.
In the next section we present the methodology followed in the study. This includes test conditions, execution dates, and equipment characteristics. Later, we will show an interactive map with the results by operator and channel, as well as a brief analysis of the results.
LTE coverage evaluation methodology
We briefly describe the methodology used for this study.
General considerations
- Date and time of measurement: Monday, Oct 12 2020, from 12:00 PM to 3:30 PM.
- Drive tests performed by Ekspresa’s engineering team in the Dominican Republic.
- Test equipment used: CellWireless Solution, from Celplan. This includes the CellDigitizer Scanner and the Cellscanner Software. Antenna of 2.7 GHz bandwidth. Equipment calibrated in October 2019.
- Drive test route: main roads and streets – central polygon of Santo Domingo.
- Post-processing applying distance binning. Measurements within hexagons of an area of 2149m² are averaged, using the hexagonal system h3 </ a> from Uber.

Frequencies
The equipment was configured to collect measurements at the following frequencies:
| Operador | Banda | # Canal (EARFCN) |
|---|---|---|
| Altice | 1900 MHz | 700 |
| Altice | 2100 MHz/1700 MHz (AWS) | 2100 |
| Altice | 850 MHz | 2450 |
| Altice | 900 MHz | 3750 |
| Claro | 1900 MHz | 900 |
| Claro | 2100 MHz/1700 MHz (AWS) | 2300 |
| Claro | 2.6 GHz | 2850 |
| Viva | 2100 MHz/1700 MHz (AWS) | 2000 |
| Viva | 2100 MHz/1700 MHz (AWS) | 2175 |
We only considered for this study the frequencies used for mobile LTE service. On this occasion, we are not measuring the coverage of residential internet services offered by Claro, Altice and Wind Telecom.
LTE Coverage levels definition
In cellular networks, there are indicators that are used to show the level of signal intensity (received power) and signal quality (signal-to-noise ratio) with which the mobile decodes the cell transmissions.
In LTE, we usually use the RSRP (Reference Signal Received Power) to measure the signal strength, and the RSRQ (Reference Signal Received Quality) and CINR </ strong> (Carrier to Interference and Noise Ratio) to measure the signal-to-noise ratio. The description of the meaning of these metrics is beyond the scope of this article, please review this link if you want to explore these definitions.
In the next analysis we will use the RSRP and the CINR for the evaluation of LTE coverage. In addition to presenting the individual RSRP and CINR values, we define three coverage “levels” or “tiers” that take both metrics into consideration.
- Level 3. Good Coverage. RSRP > -100 dBm, CINR > 10 dB
- Level 2. Regular Coverage. RSRP > -100 dBm, CINR
- Level 1. Bad Coverage. RSRP
Please note that in the field of Radio Frequency analysis the term “coverage” is often used to denote only the level of signal intensity (RSRP), however in this article we will use this word to refer to the combined indicator.
To calculate the coverage level in each bin, the RSRP and CINR samples collected with the scanner are averaged in the hexagonal area (2149m²). After this, the RSRP and CINR of all the frequencies in Table 1 are evaluated in each bin, and the best level of coverage is selected from among all the channels found for each operator. For example, if in a given bin the operator X has -110dBm of RSRP / -10 dB of CINR for EARFCN # 1 (which corresponds to level 1), and has -85dBm RSRP / 25dB CINR (Level 3) for EARFCN # 2, then this bin will be considered level 3.
Results: Who has better LTE Coverage?
In Fig. 1. a map is shown with the comparison of the three operators for the indicator “Coverage Level” described in the methodology. The map is interactive: you can select the metric to evaluate, change the frequency and zoom in or out.
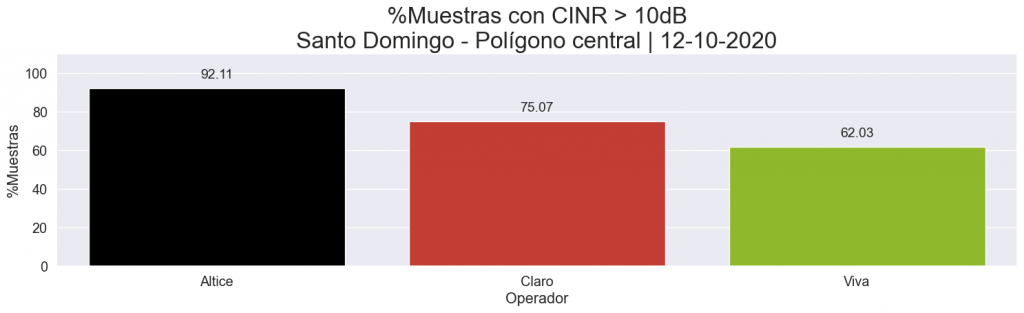
It can be seen that the operator Altice has a larger number of samples with CINR & gt; 10dB. The numerical result can be seen in Fig. 2.

Note that Altice has the highest percentage of samples in range 3, followed by Claro and Viva. As will be seen later, Altice has a carrier with CINR levels above the rest, which has an important weight in the indicator.
Let’s examine the RSRP and CINR individually:
RSRP comparison
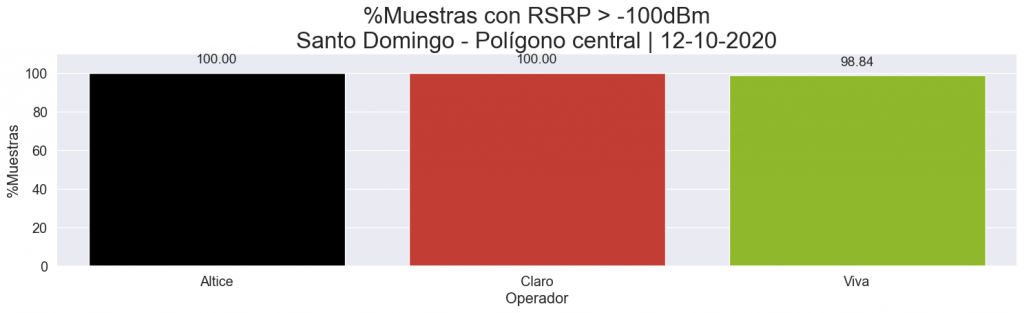
The following figure shows the RSRP statistics for the three operators, where it can be seen that they all have more than 98% of the samples above -100 dBm.
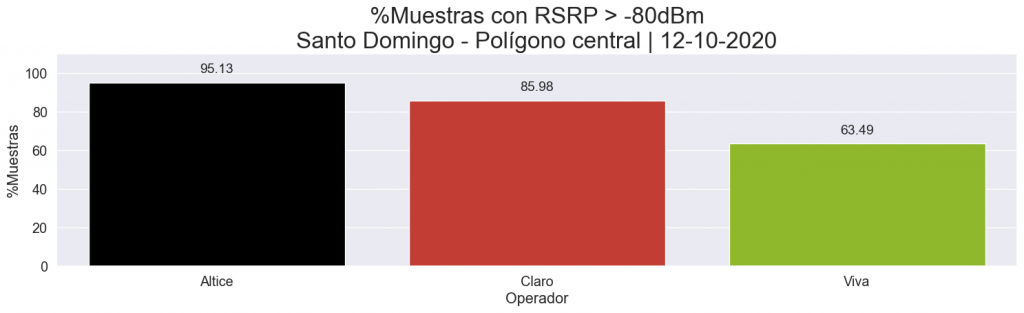
If we raise the threshold to -80dBm, we appreciate that Altice takes the advantage. This makes sense, since Altice has LTE carriers in lower pathloss bands (850MHz and 900MHz).
In the following image we see the distribution of samples by carrier. As expected, Altice’s 2450 (850MHz) and 3750 (900MHz) carriers have higher sample densities around -70dBm, which explains the results in Fig. 4.
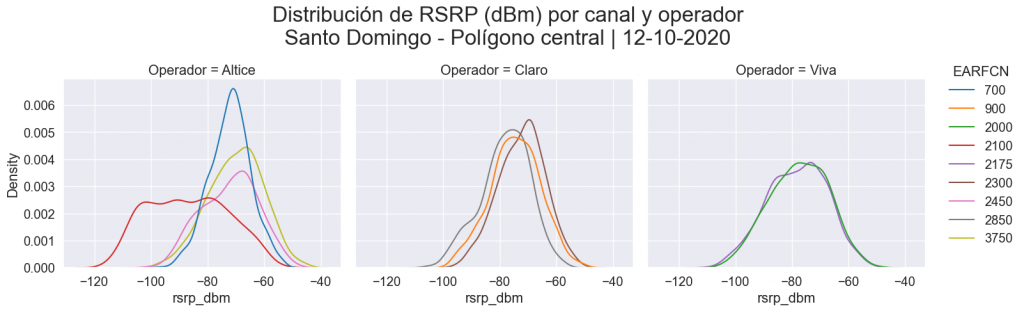
The ability to provide LTE service on “low band” carriers favors coverage in indoor scenarios. This gives the Altice operator an advantage.
CINR comparison
When we look at the CINR, we also see that Altice is leading the way.
This graph is similar to the one in Fig. 2. This makes sense: since all operators have acceptable RSRP levels (> 100dBm) within the route under study, the “Coverage Level” indicator is modeled by the CINR.
When we examine the data by carrier, we obtain the following density graph:
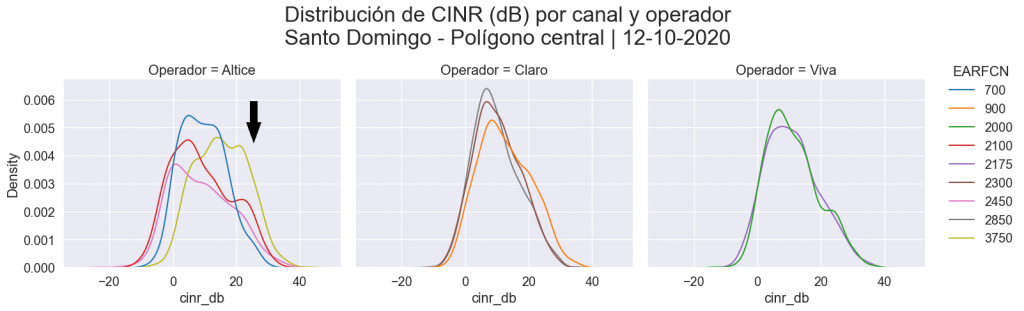
Note that Altice has one particular carrier (EARFCN 3750) with a noticeably better CINR than the others.
It is striking that this carrier is in the 900MHz band (which, together with 850, is more susceptible to interference since they have greater propagation). With the data collected we cannot precisely determine the reason for this difference. Some possible causes can be:
- Traffic imbalance between carriers as a result of a layer management strategy that favors high band carriers.
- Special parameter configuration on the 3750 carrier that favors CINR.
- Relatively low proportion of users with terminals that support this band.
If we exclude Altice’s “atypical” carrier from the analysis, the graph in Fig. 6 looks like this:
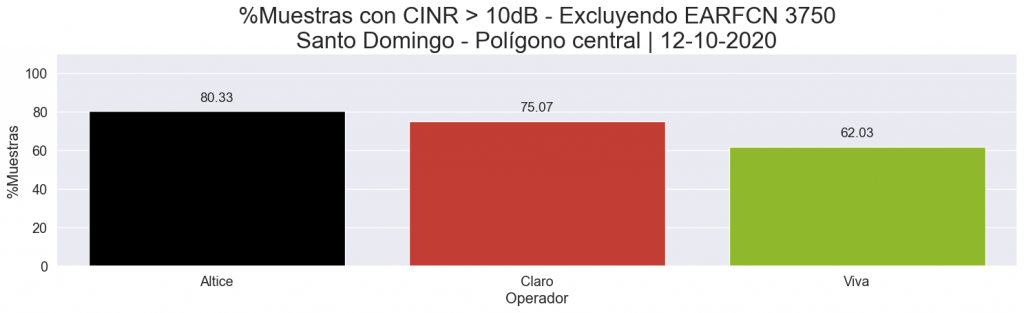
It can be observed that the gap between operators reduces, however Altice continues with slightly better interference levels.
All three operators have more than 20% of the CINR samples below 10dB. This result is expected in a city environment, where there is a higher density of base stations, which increases the interference in the radio environment.
There are multiple reasons that can affect the level of interference in an LTE network. Among these we have:
- Reference Signal Pollution (pilot pollution)
- High traffic load in cells.
- MOD 3 interference
- External interference
Conclusions
From our study we can conclude the following
- All three operators have good signal strength levels (RSRP). Altice has the advantage since it has LTE in the 850 and 900 MHz bands, which favors indoor coverage.
- Altice has better CINR levels.
- The main limitation in signal quality for all operators is given by the CINR. This behavior is to be expected given the characteristics of the area.
- Altice presents a CINR imbalance among its carriers. We don’t have enough information to identify the root cause.
- We emphasize that the analysis of signal intensity and interference only provides a partial picture of the performance of a mobile network and the user experience. To carry out an exhaustive comparison between operators, a benchmarking must be made where the different voice and data services are measured.
- The CellWireless spectrum analyzer and scanner solution is a powerful and effective tool for performing this type of coverage analysis on mobile networks.
We have prepared a PDF reports with the detailed maps per operator and channel. To access this information and the raw data (in plain text) please email us to info@ekspresa.com or through our contact form.
During the coming weeks, the Ekspresa team will continue to carry out coverage measurements on emblematic roads of the city of Santo Domingo: Av. 27 de Febrero, Av. John F. Kennedy, Av. Washington and Las Américas freeway. We invite you to follow us on Linkedin to be notified when the next reports are available.