Continuing with our LTE coverage evaluation posts, this week we present the results of the Drive Tests carried out by the Ekspresa team in the towns of La Chorrera and Arraiján. The signal intensity and coverage levels of the operators Cable & Wireless, Claro, Digicel and Tigo.
All measurements were collected using Celplan’s CellWireless multi-technology scanner solution.
The analysis that we will present in this article is based on the signal levels (RSRP and CINR) of the LTE cells measured with an RF scanner (see this link to find out why we recommend using a scanner instead of a phone). Measuring these indicators is the first step in evaluating and comparing the coverage footprint of mobile network operators.
While these measurements are valuable and relevant, they do not provide a complete picture of the users’ experience on a mobile network. To perform a complete benchmarking of the quality of service of mobile operators, additional measurements are required using mobile terminals (typically smartphones) performing an extensive test protocol for voice and data services. Even though Ekspresa has extensive experience in this type of project, for this publication we limit ourselves only to measurements collected with the scanner.
LTE coverage evaluation methodology
For this study, a methodology similar to that carried out in previous posts was followed. In summary:
- Data collection date: 11/17/2020 and 11/18/2020 from 9:00 AM to 5:00 PM.
- Drive tests performed by the Ekspresa Panama engineering team.
- Test equipment: CellWireless solution from Celplan (CellDigitizer Scanner + Cellscanner Software). Antenna with 3.5 GHz bandwidth. Device calibrated in October 2019.
- Drive test route: main routes in the towns of La Chorrera and Arraiján.
- Distance binning was applied. RF measurements averaged within hexagonal areas of 2149 m², using Uber’s h3 hexagonal system.
- Frequencies: Cable & Wireless, Claro and Digicel: 700 MHz / 1900 MHz, Tigo: 700 MHz / 1900 MHz / 2100 MHz (AWS).
- We defined a “coverage level” indicator by combining RSRP and CINR. Details following this link.
Results: Which operator has better LTE coverage in West Panama – La Chorrera / Arraiján?
“Panama Oeste” is one of the ten provinces of Panama, created on January 1, 2014 from segregated territories of the province of Panama located west of the Panama Canal. It is made up of 5 districts: Arraiján, Capira, Chame, La Chorrera and San Carlos. Its capital is La Chorrera.
The population of West Panama is approximately 500 thousand inhabitants, Arraiján being the third district with the largest population in Panama. Both are considered primarily commuter towns.
In Fig. 1. a map is shown with the comparison of the four operators for the indicator “Coverage Level” described in the methodology. The map is interactive: you can select the metric to evaluate, change the frequency and / or zoom.
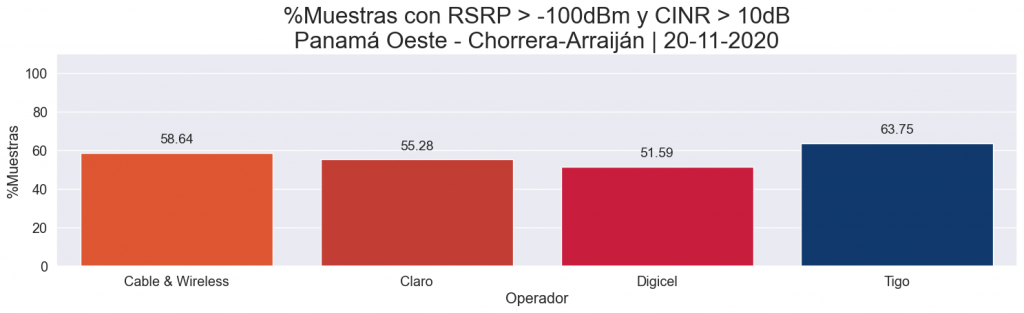
Performing a general analysis of the entire route, similar coverage levels are observed among operators, with a slight advantage for Tigo. In Fig. 2. we observe the results for the “Coverage Level” indicator described in the methodology. However, if we analyze specific areas, opportunities for improvement can be found for all operators. The main objective of a benchmarking is to compare strengths and weaknesses, in order to define actions accordingly.
Let’s examine the RSRP and CINR individually:
RSRP comparison
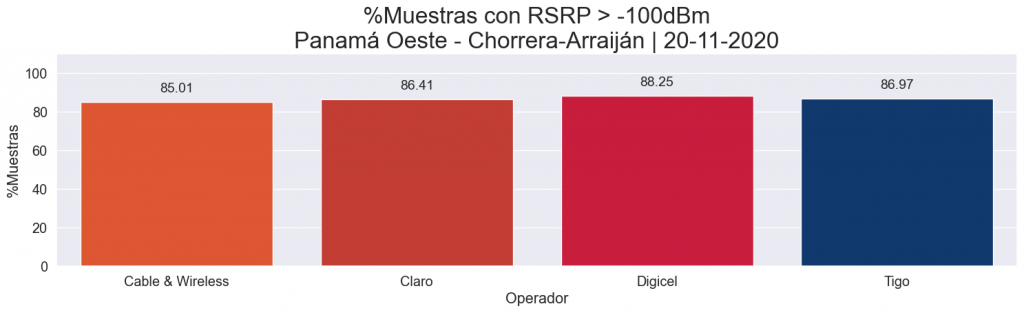
The following figure shows the RSRP statistics for the four operators, where it can be seen that all the operators have similar signal strength levels.
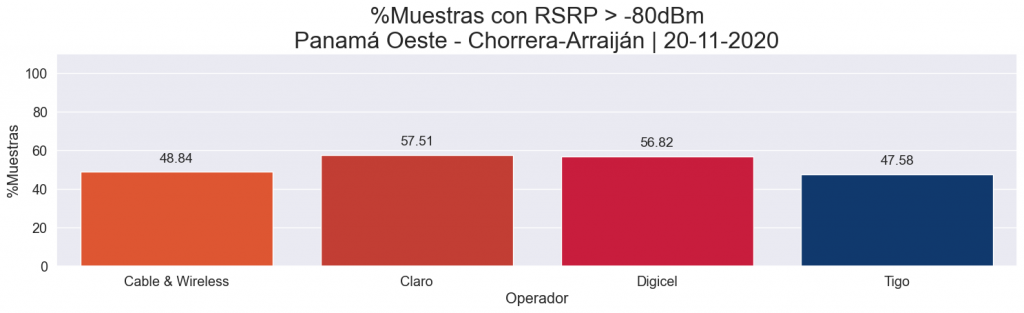
If we raise the threshold to -80dBm, we appreciate that Claro and Digicel take a slight advantage. Having better RSRP levels favors indoor coverage.
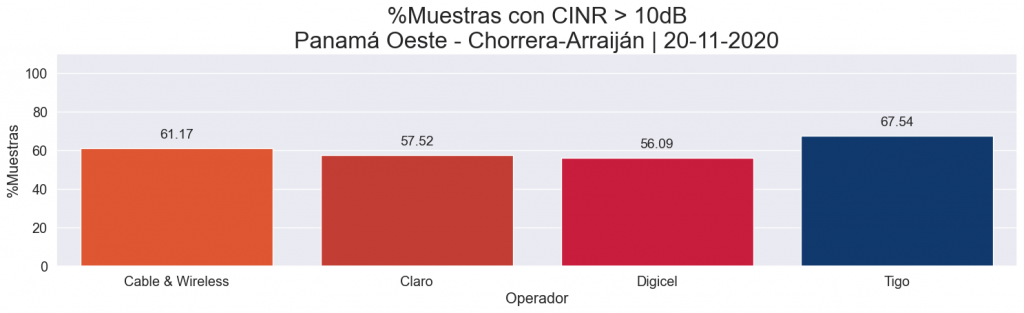
CINR comparison
Comparing the CINR, we can see that the Tigo operator has a greater number of samples above 10dB.
There are multiple reasons that can affect the level of interference in an LTE network. Among these we have:
- Traffic load in cells. This indicator is modeled by the number of subscribers the network has and the available capacity.
- Reference signal pollution (pilot pollution). The correct planning and optimization of the network helps to minimize this phenomenon.
- MOD 3 interference
- External interference.
Conclusions
From our study we can conclude the following
- Overall, the four operators have acceptable levels of signal strength (RSRP). Claro and Digicel have a slight advantage in terms of the percentage of samples above -80dBm (favoring indoor coverage).
- Tigo has slightly better CINR levels than the other operators.
- Even though the operators have statistically similar coverage levels in the area under study, there are specific areas where one or the other has an advantage. We invite the reader to review Fig. 1. in detail to identify these areas.
- The main limitation in signal quality for all operators is given by the CINR. In the drive test, Tigo has better CINR. This allows in the general analysis to be able to position in the first place despite being the one that has the last place in RSRP
- We emphasize that the analysis of signal strength and interference only provides a partial picture of the performance of a mobile network and the user experience. To carry out an exhaustive comparison between operators, a benchmarking must be made where the different voice and data services are measured.
- The CellWireless spectrum analyzer and scanner solution is a powerful and effective tool for performing this type of coverage analysis on mobile networks.
We have prepared a PDF report with detailed maps by operator and channel. To access this information and the raw data (in plain text format) write to us at info@ekspresa.com or through our contact form to request access.